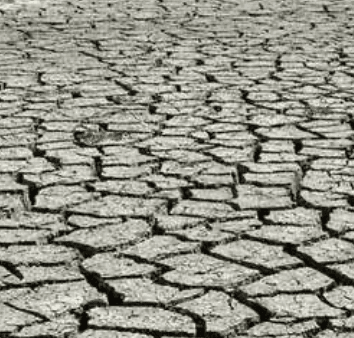
Recent observational data from the U.S. Drought Monitor (valid August 25, 2026) indicate exceptional (D4) drought covering roughly 14% of Colorado—the largest share of any state—along with pockets in the Intermountain West and northern Plains amid persistent high pressure, above-normal temperatures, and low soil moisture. Degradation occurred across the Southern Plains and Upper Midwest due to evaporative demand outpacing scattered convection, while monsoon activity brought limited relief elsewhere in the Southwest. The U.S. Drought Monitor, produced jointly by NOAA, USDA, and partners, is released weekly each Thursday and classifies conditions using multiple indicators including precipitation deficits and groundwater levels. The next map, covering the week of September 1, will reflect any late-August changes; the Climate Prediction Center’s seasonal drought outlook update follows on September 17. Strong El Niño conditions expected this fall add uncertainty to short-term intensification or relief patterns.
Resumen experimental generado por IA con datos de Polymarket. Esto no es asesoramiento de trading y no influye en cómo se resuelve este mercado. · ActualizadoSequía excepcional (D4) por estado — semana del 1 de septiembre de 2026
Sequía excepcional (D4) por estado — semana del 1 de septiembre de 2026
$22,286 Vol.
Alabama
1%
Arizona
4%
Arkansas
88%
California
2%
Colorado
94%
Delaware
5%
Florida
11%
Georgia
5%
Idaho
93%
Illinois
4%
Indiana
3%
Iowa
4%
Kansas
5%
Kentucky
3%
Luisiana
10%
Maryland
3%
Minnesota
6%
Misisipi
84%
Missouri
1%
Montana
4%
Nebraska
94%
Nevada
75%
Nueva Jersey
5%
Nuevo México
94%
Carolina del Norte
75%
Dakota del Norte
6%
Ohio
4%
Oklahoma
95%
Oregón
93%
Pensilvania
1%
Carolina del Sur
8%
Dakota del Sur
8%
Tennessee
1%
Texas
99%
Utah
94%
Virginia
2%
Washington
14%
Virginia Occidental
4%
Wisconsin
12%
Wyoming
17%
$22,286 Vol.
Alabama
1%
Arizona
4%
Arkansas
88%
California
2%
Colorado
94%
Delaware
5%
Florida
11%
Georgia
5%
Idaho
93%
Illinois
4%
Indiana
3%
Iowa
4%
Kansas
5%
Kentucky
3%
Luisiana
10%
Maryland
3%
Minnesota
6%
Misisipi
84%
Missouri
1%
Montana
4%
Nebraska
94%
Nevada
75%
Nueva Jersey
5%
Nuevo México
94%
Carolina del Norte
75%
Dakota del Norte
6%
Ohio
4%
Oklahoma
95%
Oregón
93%
Pensilvania
1%
Carolina del Sur
8%
Dakota del Sur
8%
Tennessee
1%
Texas
99%
Utah
94%
Virginia
2%
Washington
14%
Virginia Occidental
4%
Wisconsin
12%
Wyoming
17%
D4 area below 0.05% is treated as cartographic noise at state borders and resolves "No".
Alabama carries a market in May through November, so this market exists for the week valid September 1, 2026. Weeks outside that window have no Alabama market and make no claim about Alabama's drought.
Each USDM release covers the seven-day period ending Tuesday at 8:00 AM ET and is published the following Thursday.
Resolution is based on the first published US Drought Monitor release for the listed week. Subsequent revisions will not be considered; the first published release is final.
The resolution source for this market is the US Drought Monitor at droughtmonitor.unl.edu.
Mercado abierto: Aug 27, 2026, 9:00 AM ET
Fuente de resolución
https://droughtmonitor.unl.edu/DmData/DataTables.aspxResolver
0x65070BE91...D4 area below 0.05% is treated as cartographic noise at state borders and resolves "No".
Alabama carries a market in May through November, so this market exists for the week valid September 1, 2026. Weeks outside that window have no Alabama market and make no claim about Alabama's drought.
Each USDM release covers the seven-day period ending Tuesday at 8:00 AM ET and is published the following Thursday.
Resolution is based on the first published US Drought Monitor release for the listed week. Subsequent revisions will not be considered; the first published release is final.
The resolution source for this market is the US Drought Monitor at droughtmonitor.unl.edu.
Fuente de resolución
https://droughtmonitor.unl.edu/DmData/DataTables.aspxResolver
0x65070BE91...Recent observational data from the U.S. Drought Monitor (valid August 25, 2026) indicate exceptional (D4) drought covering roughly 14% of Colorado—the largest share of any state—along with pockets in the Intermountain West and northern Plains amid persistent high pressure, above-normal temperatures, and low soil moisture. Degradation occurred across the Southern Plains and Upper Midwest due to evaporative demand outpacing scattered convection, while monsoon activity brought limited relief elsewhere in the Southwest. The U.S. Drought Monitor, produced jointly by NOAA, USDA, and partners, is released weekly each Thursday and classifies conditions using multiple indicators including precipitation deficits and groundwater levels. The next map, covering the week of September 1, will reflect any late-August changes; the Climate Prediction Center’s seasonal drought outlook update follows on September 17. Strong El Niño conditions expected this fall add uncertainty to short-term intensification or relief patterns.
Resumen experimental generado por IA con datos de Polymarket. Esto no es asesoramiento de trading y no influye en cómo se resuelve este mercado. · Actualizado
Cuidado con los enlaces externos.
Cuidado con los enlaces externos.
Preguntas frecuentes