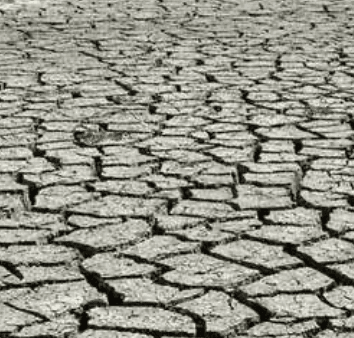
Flash drought conditions driven by above-normal temperatures and sharp precipitation shortfalls have intensified across the south-central U.S. since late August, expanding D3 and D4 areas in Texas, Oklahoma, Missouri, and adjacent states according to the U.S. Drought Monitor. As of the September 10 release (data valid September 8), exceptional drought (D4) covers 1.4% of the contiguous U.S., with short-term agricultural and hydrologic impacts dominating. The map for the week of September 15 will be released September 17 using observations through September 15; any late-week rainfall or model shifts in the Climate Prediction Center’s outlook could alter D4 boundaries before resolution. Traders should monitor National Weather Service drought statements and updated soil-moisture and streamflow data for rapid changes in these flash-drought zones.
Experimental AI-generated summary referencing Polymarket data. This is not trading advice and plays no role in how this market resolves. · UpdatedExceptional drought (D4) by state — week of September 15, 2026
Exceptional drought (D4) by state — week of September 15, 2026
Alabama
27%
Arizona
4%
Arkansas
50%
California
5%
Colorado
50%
Delaware
5%
Florida
4%
Georgia
3%
Idaho
50%
Illinois
3%
Indiana
27%
Iowa
5%
Kansas
51%
Kentucky
26%
Louisiana
25%
Maryland
26%
Minnesota
26%
Mississippi
50%
Missouri
5%
Montana
26%
Nebraska
50%
Nevada
50%
New Jersey
27%
New Mexico
50%
North Carolina
26%
North Dakota
26%
Ohio
6%
Oklahoma
50%
Oregon
50%
Pennsylvania
26%
South Carolina
49%
South Dakota
27%
Tennessee
6%
Texas
99%
Utah
5%
Virginia
26%
Washington
5%
West Virginia
5%
Wisconsin
6%
Wyoming
24%
$40 Vol.
Alabama
27%
Arizona
4%
Arkansas
50%
California
5%
Colorado
50%
Delaware
5%
Florida
4%
Georgia
3%
Idaho
50%
Illinois
3%
Indiana
27%
Iowa
5%
Kansas
51%
Kentucky
26%
Louisiana
25%
Maryland
26%
Minnesota
26%
Mississippi
50%
Missouri
5%
Montana
26%
Nebraska
50%
Nevada
50%
New Jersey
27%
New Mexico
50%
North Carolina
26%
North Dakota
26%
Ohio
6%
Oklahoma
50%
Oregon
50%
Pennsylvania
26%
South Carolina
49%
South Dakota
27%
Tennessee
6%
Texas
99%
Utah
5%
Virginia
26%
Washington
5%
West Virginia
5%
Wisconsin
6%
Wyoming
24%
D4 area below 0.05% is treated as cartographic noise at state borders and resolves "No".
Alabama carries a market in May through November, so this market exists for the week valid September 15, 2026. Weeks outside that window have no Alabama market and make no claim about Alabama's drought.
Each USDM release covers the seven-day period ending Tuesday at 8:00 AM ET and is published the following Thursday.
Resolution is based on the first published US Drought Monitor release for the listed week. Subsequent revisions will not be considered; the first published release is final.
If the US Drought Monitor has not been published by 11:59 PM ET on the day following the scheduled publication date, this market will resolve to "No".
The resolution source for this market is the US Drought Monitor at droughtmonitor.unl.edu.
Market Opened: Sep 10, 2026, 9:00 AM ET
Resolution Source
https://droughtmonitor.unl.edu/DmData/DataTables.aspxResolver
0x65070BE91...D4 area below 0.05% is treated as cartographic noise at state borders and resolves "No".
Alabama carries a market in May through November, so this market exists for the week valid September 15, 2026. Weeks outside that window have no Alabama market and make no claim about Alabama's drought.
Each USDM release covers the seven-day period ending Tuesday at 8:00 AM ET and is published the following Thursday.
Resolution is based on the first published US Drought Monitor release for the listed week. Subsequent revisions will not be considered; the first published release is final.
If the US Drought Monitor has not been published by 11:59 PM ET on the day following the scheduled publication date, this market will resolve to "No".
The resolution source for this market is the US Drought Monitor at droughtmonitor.unl.edu.
Resolution Source
https://droughtmonitor.unl.edu/DmData/DataTables.aspxResolver
0x65070BE91...Flash drought conditions driven by above-normal temperatures and sharp precipitation shortfalls have intensified across the south-central U.S. since late August, expanding D3 and D4 areas in Texas, Oklahoma, Missouri, and adjacent states according to the U.S. Drought Monitor. As of the September 10 release (data valid September 8), exceptional drought (D4) covers 1.4% of the contiguous U.S., with short-term agricultural and hydrologic impacts dominating. The map for the week of September 15 will be released September 17 using observations through September 15; any late-week rainfall or model shifts in the Climate Prediction Center’s outlook could alter D4 boundaries before resolution. Traders should monitor National Weather Service drought statements and updated soil-moisture and streamflow data for rapid changes in these flash-drought zones.
Experimental AI-generated summary referencing Polymarket data. This is not trading advice and plays no role in how this market resolves. · Updated
Beware of external links.
Beware of external links.
Frequently Asked Questions